Obesity rates have tripled since 1980 and have increased particularly fast in children. This must be due to changes in the environment because our genes don’t change this quickly.
This article contains graphs with historical trends and results from obesity studies, showing some of the main reasons why we get fat.
People Are Eating More Junk Food Than Ever

At the turn of the 20th century, people were eating mostly simple, home-cooked meals. Around 2009, about half of what people ate was fast food, or other foods away from home.
This graph actually underestimates the true change, because what people are eating at home these days is also often based on processed foods.
Sugar Consumption Has Skyrocketed

Added sugar is the single worst ingredient in the modern diet.
Numerous studies show that eating excess amounts of added sugar can lead to a much greater risk of getting type 2 diabetes, heart disease and even cancer .
The Obesity Epidemic Started When The Low-Fat Guidelines Were Published

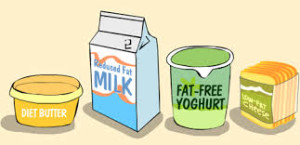
There was an epidemic of heart disease running rampant in the U.S. in the 20th century. A lot of scientists believed fat, especially saturated fat, to be the main dietary cause of heart disease (although this has since been disproven). This led to the birth of the low-fat diet, which aims to restrict saturated fat. Interestingly, the obesity epidemic started at almost the exact same time the low-fat guidelines first came out.
Putting the emphasis on saturated fat, while giving processed low-fat foods high in sugar a free pass, may have contributed to negative changes in the population’s diet. There are also massive long-term studies showing that the low-fat diet does NOT cause weight loss, and does not prevent heart disease or cancer.
People Are Drinking More Sugary Drinks and Fruit Juices

The brain doesn’t “register” liquid sugar calories in the same way as it does solid calories. That’s why liquid sugar calories are usually added on top of the daily calorie intake. Unfortunately, most fruit juices are no better and have similar amounts of sugar as soft drinks. Studies have shown that a single daily serving of a sugar-sweetened beverage is linked to a 60.1% increased risk of obesity in children.
Sugar is bad… but sugar in liquid form is even worse.
People Don’t Burn as Many Calories When Working

The graph above shows how people are now burning around 100 fewer calories per day in their jobs, which may contribute to weight gain over time.
People Are Eating More Refined Vegetable Oils

The fats we are eating have changed dramatically in the past 100 years or so.
At the beginning of the 20th century, we were eating mostly natural fats like butter, ghee and lard… but then they were replaced with margarine and vegetable oils. These refined oils are highly inflammatory, leading to disease.
People Are Sleeping Less

Poor sleep can affect various hormones, contributing to increased hunger and cravings. In recent decades, average sleep duration has decreased by 1-2 hours per night.
Short sleep duration is one of the strongest individual risk factors for obesity. It is linked to an 89% increased risk in children, and a 55% increased risk in adults.


